
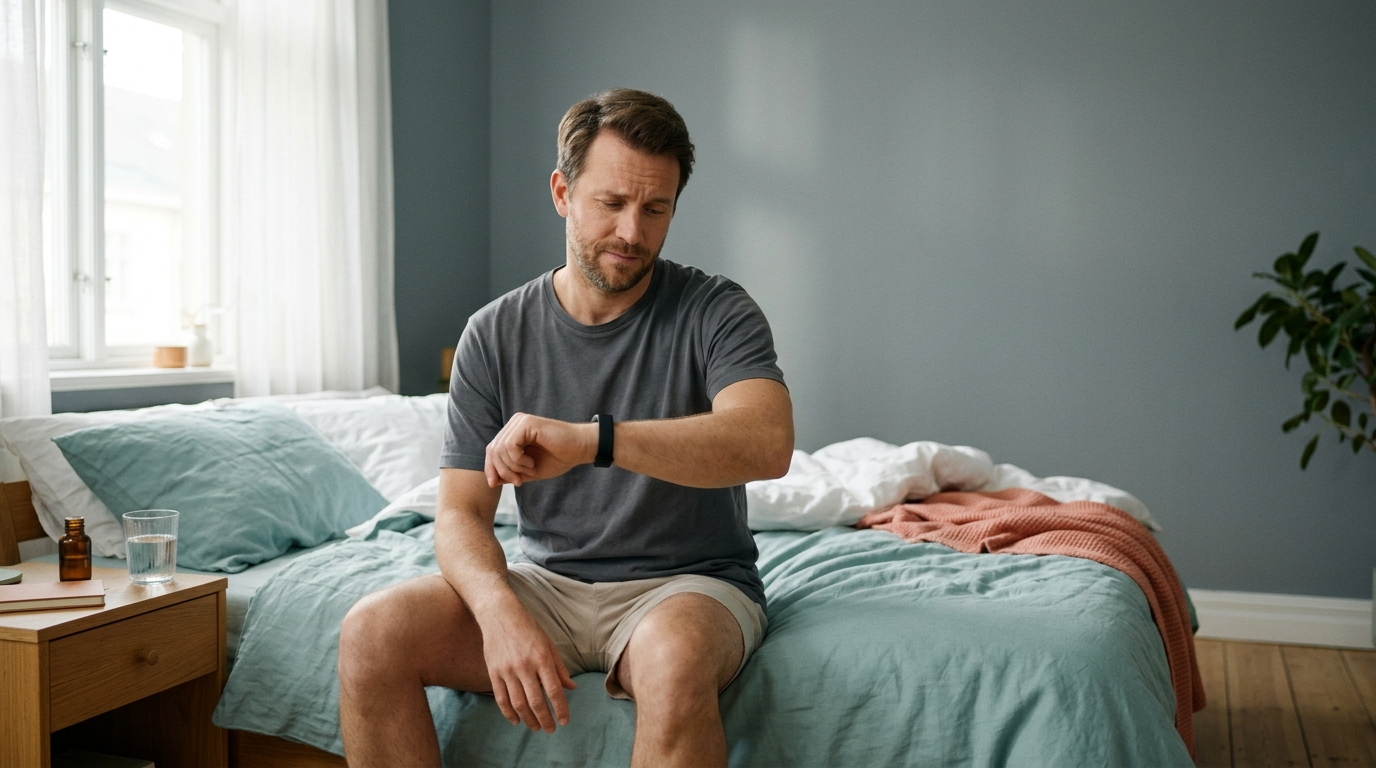
TL;DR: Wearables present every metric with the same visual confidence, but the validation literature does not support treating them equally. Three findings do most of the work. First, devices are good at detecting sleep and bad at detecting wake: sensitivity of 91.68% to 96.27% against clinical polysomnography, but specificity of only 29.39% to 52.15%, which is why every tested device overestimates sleep efficiency and underestimates time awake. Second, sleep staging sits at Cohen’s kappa 0.21 to 0.53, fair to moderate agreement, meaning a single night’s deep-sleep figure is not a measurement you should react to. Third, nocturnal resting heart rate is measured far more precisely than HRV, with mean absolute percentage error of 1.67% to 3.00% against 5.96% to 16.32% across 536 nights of ECG-referenced comparison. The practical conclusion is a trust hierarchy: resting heart rate and total sleep duration are Tier A signals you can read daily; HRV and sleep stages are Tier B, meaningful only as multi-week trends; single-night readiness scores are Tier C, composites with no independent validation, best treated as a prompt to check in with yourself rather than as data.
Every morning your wearable hands you a verdict. A readiness score. A sleep score. Deep sleep in minutes, HRV in milliseconds, all rendered in the same font, on the same card, with the same air of precision.
That presentation is the problem. These numbers are not equally reliable, and the gap between the most and least trustworthy of them is not small. Some are measured well enough to act on tomorrow morning. Others are noisy enough that responding to a single reading is worse than ignoring it, because you will change real behaviour based on measurement error.
The good news is that this is an answerable question. Sleep and cardiac wearables have been validated repeatedly against clinical reference standards, and the results are public. This guide reads that record and converts it into a usable hierarchy.
The measurement problem nobody puts on the dashboard
Start with the single most important asymmetry in the validation literature.
A 2025 study published in SLEEP Advances tested six consumer wearables against polysomnography, the clinical gold standard, across 62 adults, with data collected between April 2023 and August 2024. The devices were the Fitbit Charge 5, Fitbit Sense, Withings ScanWatch, Garmin Vivosmart 4, Whoop 4.0 and Apple Watch Series 8.
Sleep detection was strong. Sensitivity, the ability to correctly identify that you are asleep when you are asleep, ranged from 91.68% to 96.27% across all six devices.
Wake detection was not. Specificity, the ability to correctly identify that you are awake when you are awake, ranged from 29.39% to 52.15%.
That is the whole story of the modern sleep tracker in two numbers. The algorithms are heavily biased toward concluding that you are asleep. Lie still in the dark with your eyes open and your wrist will frequently record it as sleep.
The downstream consequences show up exactly where you would predict. In the same study, every device significantly underestimated wake after sleep onset, by between 12.38 and 47.94 minutes. Every device overestimated sleep efficiency, by 2.20% to 10.19%. Several significantly overestimated total sleep time, with the ScanWatch running 39.87 minutes long and the Vivosmart 4 running 38.44 minutes long.
If you have ever had a rough, broken night and then been told by your device that you slept well, this is why. It is not that your experience was wrong. It is that wake detection is the weakest part of the measurement chain.
Original analysis: how much wakefulness each device misses
The specificity figures are abstract on their own. Here is what they mean in minutes.
Consider a disturbed night in which you are genuinely awake for 60 minutes after first falling asleep, a realistic figure for anyone with a young child, a noisy street, or a stressful week. Applying each device’s published specificity gives the share of that wakefulness the device is expected to miss.
| Device | Wake specificity (published) | Share of wake time missed | Minutes of true wake scored as sleep |
|---|---|---|---|
| Apple Watch Series 8 | 52.15% | 47.85% | 28.7 min |
| Fitbit Sense | 48.80% | 51.20% | 30.7 min |
| Fitbit Charge 5 | 47.51% | 52.49% | 31.5 min |
| Whoop 4.0 | 40.13% | 59.87% | 35.9 min |
| Withings ScanWatch | 31.09% | 68.91% | 41.3 min |
| Garmin Vivosmart 4 | 29.39% | 70.61% | 42.4 min |
CEOtudent editorial framework. Specificity values are from the SLEEP Advances polysomnography validation. The 60-minute wake scenario is an illustrative modelling assumption; the missed-minutes column is derived from it.
Two things are worth noting about this table.
The first is the spread. On the same night, in the same bed, the best and worst tested devices differ by roughly fourteen minutes in how much wakefulness they overlook. Cross-device comparisons of sleep quality are therefore close to meaningless.
The second is a consistency check that gives the model credibility. The derived range here, roughly 29 to 42 minutes of missed wake, sits inside the wake-after-sleep-onset bias the same study measured empirically, 12.38 to 47.94 minutes. The arithmetic and the observed bias agree, which is what you want before trusting a derived figure.
Sleep stages: interesting, not actionable nightly
Sleep staging is where wearables are asked to do something genuinely hard: distinguish light, deep and REM sleep from wrist signals, when the clinical standard uses brain activity, eye movement and muscle tone.
The SLEEP Advances study reported overall agreement with polysomnography as Cohen’s kappa, a statistic that corrects for agreement occurring by chance. The Apple Watch Series 8 reached 0.53, the Fitbit Sense 0.42 and the Fitbit Charge 5 0.41, all moderate agreement. The Whoop 4.0 reached 0.37, the ScanWatch 0.22 and the Vivosmart 4 0.21, all fair agreement.
By stage, the best per-stage results across the tested devices were 83.27% of light sleep epochs correctly identified by the Apple Watch Series 8, 69.63% of deep sleep by the Whoop 4.0, and 68.57% of REM by the Apple Watch Series 8. Those are the best figures, not the typical ones.
A separate multicenter validation published in 2023 in JMIR mHealth and uHealth analysed 349,114 epochs from 75 participants across 11 consumer sleep trackers. Macro F1 scores for stage classification ranged from 0.26 to 0.69. The researchers also noted a specific failure pattern that matters: light sleep functions as a default category when the algorithm is uncertain, which inflates it and makes the deep and REM numbers less stable than they appear.
The practical reading is straightforward. A single night’s deep sleep figure has enough measurement error that a change of ten or twenty minutes tells you very little. A consistent shift over three or four weeks may be real. If you want to understand what sleep architecture actually does for cognition, that mechanism is better addressed directly than through a nightly number, and we covered it in the relationship between sleep architecture and cognitive performance.
HRV versus resting heart rate: the precision gap
Here is the finding that most changes how a dashboard should be read, and it is almost never mentioned in the apps themselves.
A 2025 validation published in Physiological Reports compared nocturnal resting heart rate and HRV from five wearables against a single-lead ECG reference, across 536 nights from 13 adults. The devices were the Garmin Fenix 6, Oura Generation 3, Oura Generation 4, Polar Grit X Pro and Whoop 4.0.
Resting heart rate was measured well. Correlations with the ECG reference ran from 0.92 to 0.98, and mean absolute percentage error from 1.67% to 3.00%.
HRV, measured as RMSSD, was consistently noisier. Correlations ran from 0.86 to 0.99, but mean absolute percentage error ran from 5.96% to 16.32%. Comparing the two metrics device by device shows the size of the gap:
| Device | Resting heart rate error (MAPE) | HRV error (MAPE) | HRV noise multiple |
|---|---|---|---|
| Oura Generation 4 | 1.94% | 5.96% | 3.07x |
| Oura Generation 3 | 1.67% | 7.15% | 4.28x |
| Whoop 4.0 | 3.00% | 8.17% | 2.72x |
| Polar Grit X Pro | 2.71% | 16.32% | 6.02x |
CEOtudent editorial framework. Both error columns are published mean absolute percentage error values from the Physiological Reports ECG-referenced validation; the noise multiple is derived by dividing the HRV error by the resting heart rate error for the same device.
On the same wrist, on the same night, from the same sensor, your HRV number carries roughly three to six times the measurement error of your resting heart rate number. And HRV also varies more from night to night for genuine physiological reasons, which means the signal you are trying to detect is buried under both larger measurement error and larger natural variation.
This inverts how most people use their dashboard. HRV gets the attention because it feels like the sophisticated metric. Resting heart rate gets ignored because it feels basic. The measurement evidence points the other way: resting heart rate is the more precisely measured of the two, and a sustained elevation in it is one of the more trustworthy signals a consumer wearable produces.
What this means for readiness scores
Readiness, recovery and body-battery scores are proprietary composites. Manufacturers do not fully publish their weightings, and the composites themselves have not been independently validated in the way their component inputs have.
That matters, because a composite inherits the error of its inputs. If a readiness score draws meaningfully on HRV and sleep staging, it is built substantially on the two least precisely measured things on the device. A score can be no more reliable than what goes into it.
This is not an argument that readiness scores are worthless. It is an argument about what kind of object they are. A readiness score is a reasonable daily prompt to consider how you feel and whether to push hard today. It is not a measurement, and treating a drop from 82 to 74 as evidence of anything specific is reading precision into a number that does not contain it.
The honest test is simple: if the score says you are recovered and you feel exhausted, you are the better instrument. The failure mode worth avoiding is the one where people override clear subjective signals because a number disagreed with them.
The CEOtudent trust framework: three tiers
Putting the evidence together produces a usable hierarchy.
| Tier | Metrics | Evidence basis | How to use it |
|---|---|---|---|
| Tier A: act on it | Resting heart rate, total sleep duration, sleep timing consistency | RHR mean absolute error 1.67% to 3.00% vs ECG; sleep detection sensitivity 91.68% to 96.27% vs PSG | Read daily. A sustained multi-day rise in resting heart rate is a genuine flag. Duration and timing are measured well enough to manage directly. |
| Tier B: trends only | HRV, deep sleep, REM sleep, sleep efficiency | HRV error 5.96% to 16.32%; staging kappa 0.21 to 0.53; efficiency overestimated 2.20% to 10.19% | Ignore single nights entirely. Compare rolling multi-week averages against your own baseline, never against another person or another device. |
| Tier C: do not react | Readiness, recovery and body-battery composites; single-night stage minutes | Proprietary composites without independent validation, built partly on Tier B inputs | Treat as a conversation starter with yourself, not a measurement. If it conflicts with how you feel, trust how you feel. |
CEOtudent editorial framework, synthesised from the polysomnography and ECG-referenced validation studies listed in the sources.
One rule cuts across all three tiers: compare yourself only to yourself, on the same device. Absolute values are not comparable across manufacturers, as the fourteen-minute spread in missed wakefulness and the six-fold spread in HRV error both demonstrate. Your own baseline on your own hardware is the only fair reference point, which also means changing devices resets your history.
The CEO reads instruments, the student reads limits
There is a management lesson buried in this, and it generalises well beyond sleep.
A CEO who receives a dashboard does not treat every figure on it as equally solid. Some numbers come from audited systems and some from a spreadsheet somebody maintains by hand. The competent response is not to ignore the dashboard or to trust it uniformly, but to know the measurement quality behind each line and to size decisions accordingly. Nobody restructures a business on a metric with a 16% error bar.
Most wearable users have never applied that discipline to their own body dashboard. They react to the noisiest number on the screen because it is presented as confidently as the most reliable one. That is a data-literacy failure, not a health failure, and it is the same failure that leads people to over-manage a personal system based on daily fluctuation. The wider version of this problem, treating exhaustion as a number rather than a systems signal, is one we examined in burnout as a systems failure.
The student side is knowing the limits of your instruments and staying curious as they improve. These devices are getting better, and the validation record changes with each hardware and firmware generation. The 2025 HRV study made exactly this point, stressing the need for continuous validation as new hardware and software updates ship. A conclusion about a 2023 device is not automatically a conclusion about its 2026 successor. Hold the framework, update the figures.
What to actually do tomorrow morning
Four changes, in order of impact.
Move your attention to resting heart rate. It is the best-measured number your device produces and it responds to illness, alcohol, heat, overtraining and stress. A rise of several beats sustained over multiple days is worth taking seriously.
Stop reading single-night stage data. Deep sleep minutes for last night are not a measurement you can act on. Look at rolling averages over weeks or turn the display off.
Downgrade HRV from daily signal to monthly trend. Given three to six times the error of resting heart rate, plus real biological variability, day-to-day HRV movements are mostly noise. Multi-week direction is the usable signal.
Treat total sleep duration as approximately right but flattering. Sleep detection is genuinely strong, but the wake-detection weakness means your device is likely crediting you with more sleep than you got. If your target is seven and a half hours and your device reports exactly that, you are probably a little short.
None of this means the devices are useless. Sleep detection at above 91% sensitivity is a real achievement, resting heart rate at under 3% error is genuinely good measurement, and long-run trends carry real information. The waste is in reacting to precision that the measurement does not support, and the fix costs nothing except knowing which numbers have earned your attention.
Frequently asked questions
Is my sleep tracker’s deep sleep number accurate?
Not accurate enough to act on nightly. Against polysomnography, the best tested device correctly identified 69.63% of deep sleep epochs, and overall stage agreement across six devices ranged from Cohen’s kappa 0.21 to 0.53, fair to moderate. Light sleep also serves as a default category when the algorithm is unsure, which distorts the other stages. Multi-week trends in deep sleep may be informative; a single night’s figure is not.
Should I pay more attention to HRV or resting heart rate?
Resting heart rate, on measurement grounds. Across 536 ECG-referenced nights, resting heart rate carried mean absolute percentage error of 1.67% to 3.00% while HRV carried 5.96% to 16.32%, making HRV roughly three to six times noisier on the same device. HRV still carries information over weeks, but resting heart rate is the more trustworthy day-to-day signal.
Why does my device say I slept well when I know I was awake?
Because wake detection is the weakest link. Tested devices identified sleep with 91.68% to 96.27% sensitivity but wake with only 29.39% to 52.15% specificity, so a large share of quiet wakefulness gets scored as sleep. This is also why every device in that study underestimated time awake and overestimated sleep efficiency. Your experience is the more reliable account of a broken night.
Are readiness and recovery scores based on validated science?
Their component inputs have been validated; the composites themselves have not been independently validated in the peer-reviewed record, and manufacturers do not fully publish their weightings. Since these scores draw partly on HRV and sleep staging, the two least precisely measured metrics, they inherit that error. Use them as a daily prompt rather than a measurement.
Can I compare my sleep score with someone using a different device?
No. The spread across devices is too large for that comparison to mean anything. On an identical night, tested devices differed by roughly fourteen minutes in how much wakefulness they missed, and HRV error varied more than six-fold between the best and worst performers. Compare only to your own baseline on your own device, and reset expectations when you change hardware.
Do these findings apply to the newest devices?
Partly, and this needs care. The validation record here covers specific hardware generations tested between 2023 and 2025. Algorithms change with firmware updates, and the researchers behind the 2025 HRV validation explicitly stressed the need for continuous validation as new hardware and software ship. The structural finding, that wake detection and HRV are harder to measure than sleep detection and resting heart rate, is likely to persist, because it reflects the physics of what a wrist sensor can observe. The specific percentages will move.
Sources
- Physiological Reports, Validation of nocturnal resting heart rate and heart rate variability in consumer wearables, 2025
- SLEEP Advances, Oxford University Press, performance validation of six commercial wrist-worn wearable sleep-tracking devices for sleep stage scoring compared to polysomnography, 2025
- JMIR mHealth and uHealth, Accuracy of 11 Wearable, Nearable, and Airable Consumer Sleep Trackers: Prospective Multicenter Validation Study, 2023
- Journal of Clinical Sleep Medicine, American Academy of Sleep Medicine, meta-analysis of consumer wrist-worn sleep tracking devices compared to polysomnography, 2025
- American Academy of Sleep Medicine, clinical guidance on polysomnography as the reference standard for sleep measurement
- World Health Organization, guidance on physical activity and sedentary behaviour
This content was compiled with the support of AI following in-depth research, then written and prepared for publication by the CEOtudent editorial team.
This post is also available in:














)
&description=&image=https://ceotudent.com/wp-content/uploads/2026/08/hrv-sleep-scores-readiness-which-wearable-metrics-actually-mean-anything-1024x572.png)